Among the most prominent indicators cited by international think tanks regarding the state of inequality[1], are the data disseminated by the World Inequality Database (WID). In 2019, according to WID, 1% of the highest-income Egyptians received 19% of the total national income, while the 50% of the lowest-income Egyptians received only 17.2%. Also, the top-income 10% of Egyptians received 48.7% of the total national income, which means that only one million Egyptians received a higher percentage of the national income than that received by 50 million Egyptians. Given that the top-income 10% of Egyptians obtained about 50% of the total national income, this means that 90 million Egyptians (90% of the population) received only 50% of the country’s national income, while the other 50% went to only 10 million Egyptians (10% of the population).
These figures reveal the extent of the gross imbalance in income distribution, and cast major doubts about the accuracy of the data announced by the Egyptian Central Agency for Public Mobilization and Statistics (CAPMAS) on the average annual income of the Egyptian household, which has, according to CAPMAS, developed from EGP 13.46 thousand annually in FY 2004-2005 to EGP 58.85 thousand annually in FY 2017-2018[2], as the CAPMAS indicator tends to measure a simple arithmetic average of household income, overlooking the reality of the gross income imbalance among various households, in addition to the fact that the survey method leads to misleading results simply because some respondents refrain from answering the survey questions accurately or sometimes even choose not to respond.
However, the issue of income inequality is related to a more serious fundamental issue in Egypt, namely the wealth inequality, where the richest 10% of Egyptians owned 61% of total wealth in 2000, despite having only 28.3% of the income. In 2007, their wealth share jumped to 65.3% despite the decline in their income share to 25.57% in 2008, which makes the gap in wealth distribution one of the largest across the world. According to a study conducted by the French Institute for International and Strategic Affairs (IRIS) in 2017, Egypt was the eighth worst country in terms of wealth distribution. In addition, in 2014, the richest 1% of Egyptians owned half the wealth of all Egyptians, compared to owning a third of that wealth in 2000[3].
Some international institutions are trying to balance this picture by introducing another indicator, but it is distorted. According to Index Mundy data, the value for GINI index (World Bank estimate) in Egypt was 31.80 as of 2015; and over the past 25 years this indicator reached a maximum value of 32.80 in 1999 and a minimum value of 28.30 in 2012[4] – the period during which Egypt witnessed the January Revolution. What does this indicator mean? And how is it built? Despite the low percentage of the equality index, the World Bank / Mundi index does not reflect the reality of the picture revealed by the World Inequality Database, because it is affected by modifications of the geometric averages that ultimately affect the real picture.
According to the World Bank’s definition, the “Gini index measures the extent to which the distribution of income (or, in some cases, consumption expenditure) among individuals or households within an economy deviates from a perfectly equal distribution.” The Gini index measures the area between the Lorenz curve (which plots the cumulative percentages of total income received against the cumulative number of recipients, starting with the poorest individual or household) and a hypothetical line of absolute equality, expressed as a percentage of the maximum area under the line. Thus a Gini index of 0 (zero) represents perfect equality, while an index of 100 implies perfect inequality[5].
However, a study conducted by Dr. Adel Abdel Ghafar for Wiley, argues that these figures are misleading. Abdel Ghafar believes that the main problem with the Gini index is the failure to measure top incomes, which leads to the transformation of measuring inequality into an unrealistic picture. “According to the World Bank, a key problem is the mismeasurement of top incomes and how it skews the measurement of inequality.” The study attributes the reason for the poor credibility of the indicator to the fact that income or expenditure inequality is measured using household budget surveys in a sample representative of the national population. “If the survey sample were designed properly and all individuals responded accurately to all income and expenditure questions, such surveys would be ideal to measure inequality. However, if respondents choose not to respond to surveys and others do not respond to income or expenditure questions, this results in a mismeasurement of inequality,” Abdel Ghafar states. Abdel Ghafar also points out that there is ongoing academic debate over which approach comes closer to capturing inequality, according to the World Bank, and that there is consensus that inequality in Egypt has been underestimated[6].
Egyptian governments tend to use the “figures” game to shade the true picture of poverty in Egypt. For example, Egyptian Prime Minister Mostafa Madbouly announced in December 2020 that the poverty rate in Egypt recorded 29.7%, considering that such decline “reflects the seriousness of the Egyptian government in fighting poverty”[7], and the poverty rate was – according to the income, expenditure and consumption data for FY 2017-2018, issued by the Central Agency for Public Mobilization and Statistics, recorded 32.5% of the total Egyptians[8], a percentage that at the time reflected the increase in the poverty rate compared to 2015 by the addition of a new segment of 5% of Egyptians, where the poverty index in 2015 was 27.8% of all Egyptians.
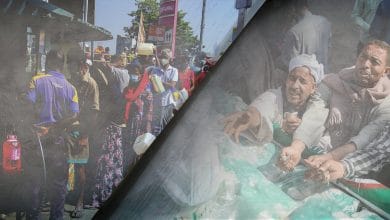
In this context, Upper Egypt (southern Egypt) topped the list of the poorest governorates over the country, and despite the high average poverty rate, the picture appears darker when we look at the figures of the governorates of Upper Egypt, where Assiut recorded the highest poverty rate among its citizens, reaching 66.7%, followed by Sohag with 59.6%, Luxor 55.3%, El Minya 54%, and Qena 41%[9]. A report of The Economist magazine in this regard refers to the statement of the World Bank, which was announced in response to the 2019 statement, that 60% of Egyptians are among the poor or the poorest segments[10].
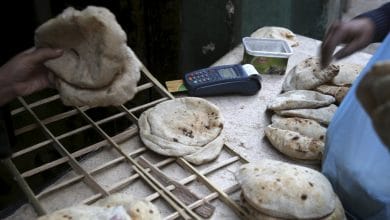
Egypt sets the national poverty line at an annual per capita expenditure level of EGP 8,800 (approximately $564), with an average monthly expenditure of EGP 733 (approximately $47), while it sets the extreme poverty line at an annual expenditure level of EGP 5,900 (approximately $378), with an average monthly expenditure of EGP 491 (approximately $31)[11]. Meanwhile, the World Bank defines the poverty level as a global value that takes into account economy levels across different countries of the world at a rate of $3.2 per day; that is, $96 per month, while the extreme poverty line is set at $1.9 per day (i.e. $57 per month)[12], which means that the extreme poverty line in Egypt is about the middle of the global rate adopted by the World Bank, taking into account various income levels across the world. This indicates a real disaster, especially with reference to the fact that the averages promoted by the Egyptian Central Agency for Public Mobilization and Statistics do not take into account the reality of the severe income disparity revealed by the international inequality database.
The general unemployment rate in Egypt is about 7.9% of the population, according to the CAPMAS data, where this rate rises to 21.77% among females. The total unemployment rate in governorates such as Damietta rises to about 21.1%, while it ranges between 11.4% and 15.5% in Cairo, and 10.9% in Alexandria, which are considered by the Central Agency for Public Mobilization and Statistics as wealthy governorates. The unemployment rate is also relatively higher in two basic education categories, the largest of which is the undergraduate and graduate categories at 48.8%, followed by post-high school intermediate category at 34.9%[13], which means that the educational process in Egypt goes without any planning to absorb qualitative learners in the labor market, where unemployment rates are low among the uneducated categories. The report does not mention the unemployment rate among the younger age groups.
Inequality is reproduced by perpetuation and intersection of different types of inequality, including income inequality, as well as differences in wealth, education, gender, employment, and health. These inequality pathways are repeated and entrenched across generations, inhibiting social mobility. However, experts add a new resource to reinforce inequality, namely: the tax system[14].
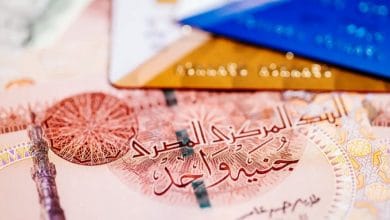
Government policies over the past two decades have shifted the tax burden onto low-income people. In the aftermath of the January 2011 revolution, there were modest attempts to increase the tax rate for higher income categories, and to introduce a new form of moderately progressive taxation. These reform attempts were met with fierce resistance from business groups. Accordingly, the income tax rate for the highest earners rose briefly to 30% in the aftermath of the January revolution (2011), but soon fell to 22.5% in August 2015. However, this tax rate rarely finds a way to be implemented, given that Egyptian businessmen enjoy better opportunities to obtain incentives and tax exemptions, which actually brings Egypt closer to implementing the severe regressive tax system. The same thing applies to the value-added tax, as the burden of this tax falls more on Egypt’s poor, who tend to use the bulk of their income for consumption-related purchases. In this context, the poorest 10% of the country’s citizens spend 6.4% of their income on value-added tax, while the richest 10% spend only 3.34% of their income on the same tax.
There is a question raised by an Egyptian writer, Osama Gharib, in one of his articles, that “Poverty reduces immunity and weakens resistance to deviation, which is self-evident, but does this mean that wealth grants its owners immunity and necessarily makes them honorable?”[15]. This question is related to another aspect of disparity in income and wealth, that is intertwined with the absence of the authority of the law, the authorities’ pursuit of money, and the reluctance of citizens, and perhaps their inability to extend their control over the performance of the authority in their country, which leads to the wealthy people to dare to loot the public money, or seek the advantages that enable them to obtain more of the wealth “aggregate”, whether by obtaining economic privileges through discrimination resulting from bribery, or violating the terms of the production process to save production expenses, the consequences of which are borne by the citizen through his spending on the health sector.
Footnotes
[1] Income inequality, 1980-2019, World Inequality Database: https://bit.ly/3kcT57n
[2] Average annual family income, Central Agency for Public Mobilization and Statistics. https://bit.ly/3i6Sqlm
[3] Adel Abdel Ghafar, Causes and Consequences of Inequality in Egypt, Wiley Online Library, 7 February 2021. https://bit.ly/3hGOrN6
[4] Egypt – GINI index (World Bank estimate), https://bit.ly/3edlp5G
[5] GINI index (World Bank estimate) – Country Ranking. https://bit.ly/2Vx34tP
[6] Adel Abdel Ghafar, Causes and Consequences of Inequality in Egypt, Wiley Online Library, 7 February 2021. https://bit.ly/3hGOrN6
[7] The poverty rate has decreased in Egypt for the first time in 20 years, Al-Ain, December 3, 2020. https://bit.ly/3fdoZxB
[8] Yasmine Selim, What is the poverty line and how is it calculated in Egypt?, Masrawy, July 30, 2019. https://bit.ly/3vfV6Cy
[9] The poverty rate in Egypt rises to 32.5 percent of the population, BBC Arabic, July 30, 2019. https://bbc.in/3hEfOHY
[10] Editorial, Poor on the Nile.. Egypt is reforming its economy, but poverty is rising, The Economist, Aug 10th., 2019 edition. https://econ.st/3eh1mmW
[11] The value of the extreme poverty line per capita annually, Central Agency for Public Mobilization and Statistics. https://bit.ly/3i6Sqlm
[12] Poverty, International Bank for Reconstruction and Development, October 7, 2020. https://bit.ly/3edCSuG
[13] Egypt in Figures, Central Agency for Public Mobilization and Statistics, Report 2021, pp. 46-58.
[14] Adel Abdel Ghafar, Causes and Consequences of Inequality in Egypt, Wiley Online Library, 7 February 2021. https://bit.ly/3hGOrN6
[15] Osama Gharib, Why do the rich steal?, Al-Masry Al-Youm, March 15, 2019. https://bit.ly/3zgOW6T